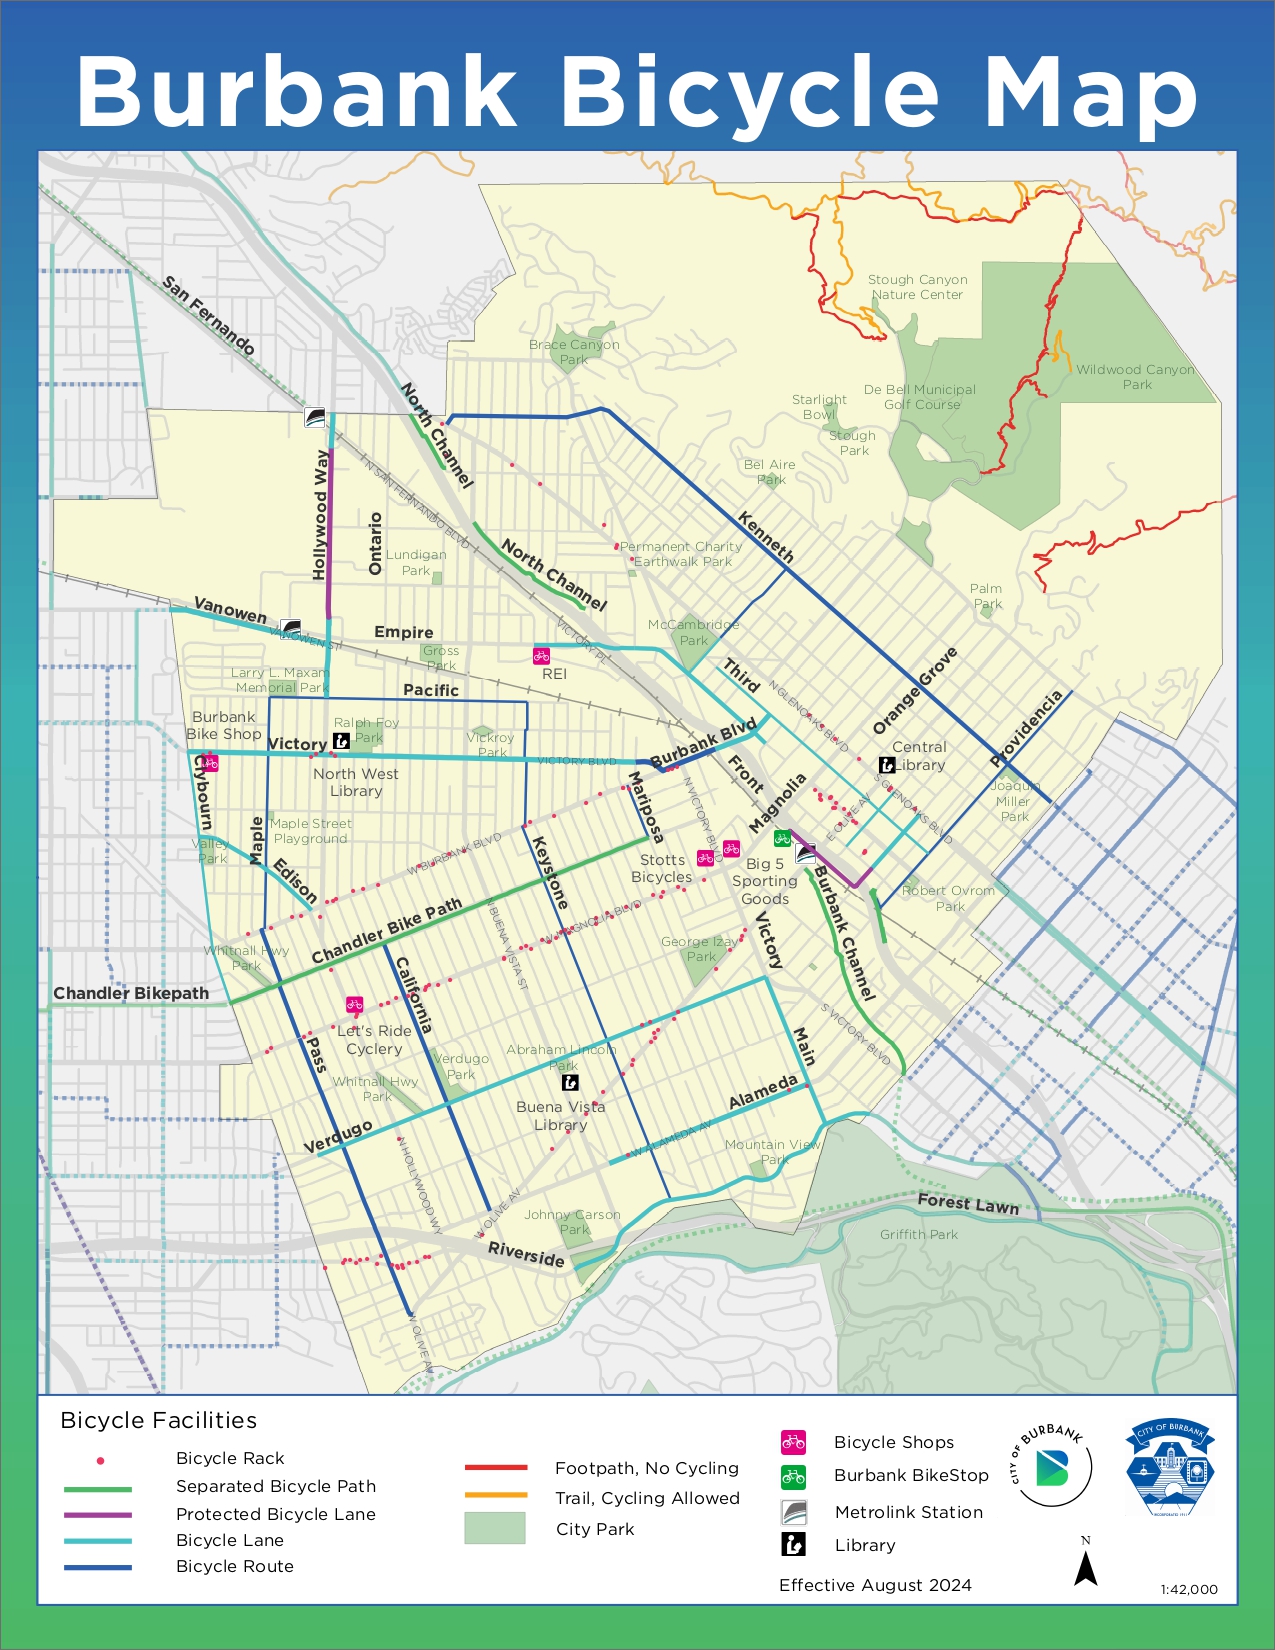
Select the image above to download or see it up close!

We are excited to roll out our new Bike Safety Score Map, which incorporates various types of data, including accident data, current bike lane infrastructure, and other bikeability metrics (road type, speed limit, # lanes, ect.) to create a bike safety score index. This type of map gives those who are thinking of cycling in Burbank a tool to plan their route based on comprehensive safety data. 

Key (Look on Map for Color Scheme):

Dedicated Bike Paths, Safest Options – Paths only meant for pedestrians and cyclists, safest option for biking.

Ideal Road Segments for Biking – Following NACTO and other previous research, these are the road segments that are safest for bikes where bike and cars share a road.

Bike Safe Roads, Exercise Caution – These are road segments that do not meet the thresholds of an ideal safe biking road, but have relatively safe speed limits for cars, and no accident history with bikes. Medium caution is advised.

Dangerous Road Segments – These roads have high speed limits, high traffic, poor bike lane infrastructure or previous history of accidents. High caution is advised if you are biking here.

Do not Bike on a Highway – Do not attempt to bike here.

Methods: Speed limit for cars, road segment length, number of lanes, road intensity, accident history, and current bike lane infrastructure are used to determine the safety of a road segment. The different levels of safety are based on prior research showing that under 25 mph speed limit roads, residential side streets, and road segments/blocks that do not exceed 400 feet in length are safest for cyclists. This research and data was found through OpenStreetMaps, NACTO, SCAG, and other sources.
COMING SOON THE BIKE SAFETY INTERACTIVE MAP!!!  
We are currently developing an interactive Bike Safety Map with detailed information about each street segment and its score, images of the street, and input options for comments and feedback for the map!